Water Flow Rate Calculations
The flow rate calculation is the basis for all of your water system calculations; it informs: Water Velocities, Pipe Sizes, System Pressures, Dead Legs, Heat Loss and Recirculation Plant Sizes
Download your free PDF of this article below.
The flow rate calculation is the basis for all of your water system calculations; it informs:
- Water Velocities
- Pipe Sizes
- System Pressures
- Dead Legs
- Heat Loss and Recirculation
- Plant Sizes
If you calculate the incorrect flow rate, there is a considerable knock-on effect that can lead to various parts of your design being non-compliant.
What is the water flow rate calculation?
The flow rate you calculate, and size your whole system based upon, is called the Peak Flow Rate (PFR).
The PFR is the maximum amount of water expected to go through the system based on what is connected downstream.
The more fixtures a pipe supplies, the higher the PFR is likely to be. However, nuances, variables, and extra considerations will also inform your calculations.
For example, the PFR varies drastically depending on which country you are in:

The image above shows that the PFR could be either 3.88L/s or 37.40L/s for identical buildings.
What if the peak flow rate is exceeded?
Supposedly, the PFR could be exceeded in rare events, and local Standards accept this.
The reality, backed by current data, is that the PFR calculation is hugely conservative, and consequently, the outcome is massively oversized results.
This is because the study that led to the PFR calculations was very conservative and was undertaken decades ago when fixtures used much higher flow rates than they do today.
Consequently, although the results were already oversized, they have become more incorrect as fixture flow rates have decreased over time.
How do you calculate the PFR?
To calculate the PFR, we need to know each part of the building that will require water.
Some items that require water are obvious, and some are less obvious. Communicating with the whole design team is essential to determine if they have any water demands.
In addition to the requirement for water, it is crucial to ensure you find out the flow rate and how likely it is to operate.
Some examples of items that require water are:
- Fixtures (showers, sinks, etc.)
- Architectural elements (green walls, swimming pools, etc.)
- Mechanical plant (boilers, cooling towers, etc.)
- Fire system (fire hose reels, fire hydrants, etc.)
- Future expansion (extra building, extra level, etc.)
- Future fit-out areas (café, office space, etc.)
Once you have a list of everything that is going to be connected to your system, you need to decide if they fall into the category of:
1. Diversity Flow Rates
This is where the fixture/appliance is not expected to be used frequently or for long periods.
This is suitable for most fixtures, such as a shower, where it is likely to operate only a couple of times per day for relatively short periods.
Each ‘diversity’ fixture has a loading unit (LU) that the local Standard prescribes.
2. Continuous Flow Rates
This is where the flows are expected to be used for long periods at full capacity.
This is suitable for items such as cooling towers, where the flow rate could be continuously drawn from the water system during some months.
Example Project
Let’s work through the flow rate calculation process.
Our design process will be as follows:
- Count how many fixtures are connected to each pipe
- Ask the architect if the building is likely to change in the future
- Ask the architect if they have any water requirements
- Ask the architect if the building is likely to change in the future
- Calculate the flow rates
1. Fixture Count
There are lots of fixtures throughout the building.
We need to count how many fixtures are connected downstream for each pipe.
In this example, we will work on the incoming cold water pipe to the building as it has the most demand upstream:
- Basin: 8
- Shower: 2
- WC: 6
- Kitchen Sink: 6
You will need to repeat this process for each pipe section through the system as the fixtures connected downstream will change as pipes branch off to serve different parts of the building.
Hot water pipes will also need to be done separately from the cold as the demand will differ, i.e. WCs do not require hot water.
It is a tedious, repetitive, but essential process – if we get the flow rate wrong, remember that everything else we calculate in the water system will be wrong, from pipe to plant sizes.
Note – for the cold water pipe that supplies the building’s fixtures and the hot water plant (that supplies the same building fixtures); you only need to add the loading units together if the fixture has separate hot and cold water outlets. If the fixture only has one outlet, as most modern-day fixtures do, the hot and cold water generally is not at full capacity at the same time. An example of this design strategy is shown in the Institute of Plumbing:

2. Engineering Water Requirements
The mechanical engineer has asked us to provide the following water requirements for their system:
- Cooling Tower: 2.5L/s (Continuous Flow i.e. will to run frequently)
- Boiler: 0.4L/s (Diversified Flow i.e. will not run frequently)
3. Architectural Water Requirements
The architect has asked us to provide the following water requirements for their design:
- Green Wall: 0.3L/s (Diversified Flow, i.e. will not run frequently)
4. Future Water Requirements
The architect has informed us that there are plans to add an extra level to the building within the next five years.
The new level will be identical to the proposed Level 1, which will consist of an extra:
- Basin: 4
- Shower: 1
- WC: 3
5. Peak Flow Rate Calculation
Now we have all of the required information; we can turn it into a PFR.
5.1 Standard
To do this, you need to choose your local standard. In this example, we will use the CIPHE standard, but the process is identical for most standards.
5.2 Loading units
We need to find the loading units (LU) of each fixture from the table below:

Based on a medium frequency of usage, the LU are:
- Basin: 2LU x 12 = 24LU
- Shower: 3LU x 3 = 9LU
- WC: 2LU x 9 = 18LU
- Kitchen Sink: 5LU x 6 = 30LU
- Total: 81LU
Note – we include the future fixtures in the calculations. If we didn’t do this, the extra demand that the future fixtures create on the water system would require the pipes within the building to be replaced and upsized. Including the demand in the initial design is much more cost-effective and less disruptive.
5.3 Convert LU to flow rate
Then we can turn that sum of LU into a flow rate using the conversion table:

As you can see above, 81LU from the fixtures equals approximately 1.07L/s.
Then, using the conversion table above, we can reverse engineer the diversified flow rates (from the mechanical engineer and architect) to find out what LU they are :
- Boiler: 0.4L/s = 17LU
- Green Wall: 0.3L/s = 10LU
- Total: 27LU
27LU equals approximately 0.53L/s.
Note that you do not combine the two diversified flow rates (1.07L/s and 0.53L/s); you find the total LU (108LU) and see the new conversion, approximately 1.32L/s:

Understanding the conversion is not linear between the number of fixtures and the diversity flow rate is critical.
The more fixtures there are, the fewer fixtures are expected to operate simultaneously.
An approximate example of the likely percentage of fixtures to run simultaneously is shown below:
1 Fixture = 100%
10 Fixtures = 30%
100 Fixtures = 12%
5.4 Continuous flow rates
The final step is to add the continuous flow rate of 2.5L/s from the Cooling Tower.
This is a simple calculation where we add 2.5L/s to the diversity flow rate of 1.32L/s.
The PFR for this pipe is now 3.82L/s.
6. Design Change
Although it is frustrating, it is common for architects to redesign buildings as they receive ongoing feedback from the design team, project manager, client, quantity surveyor, etc.
A realistic example of this could be that there has been instruction for the design team to include two sinks and a dishwasher in all of the offices and future fit-outs.
This will add a significant extra demand on the water system.
Whilst it is not enjoyable to do the tedious calculation process again, it is essential to do so. The additional flow rate through each pipe will change every component size on the project.
The new fixtures in the office fit out have the following LU:
- Dishwasher: 2LU x 12 = 24LU
- Kitchen Sink: 5LU x 24 = 120LU
The total LU on the project now equals 252LU, which gets converted to 2.45L/s.
In addition to the 2.5L/s continuous flow, the total PFR is now 4.95L/s.
This is an increase of 1.13L/s from the earlier design.
This flow rate increase means:
- The velocity of the water through the pipe has increased;
- Pipe sizes need to increase;
- There is increased heat loss through the system;
- The pressure in the system changes; and
- Plant sizes change.

How Can H2X Help?
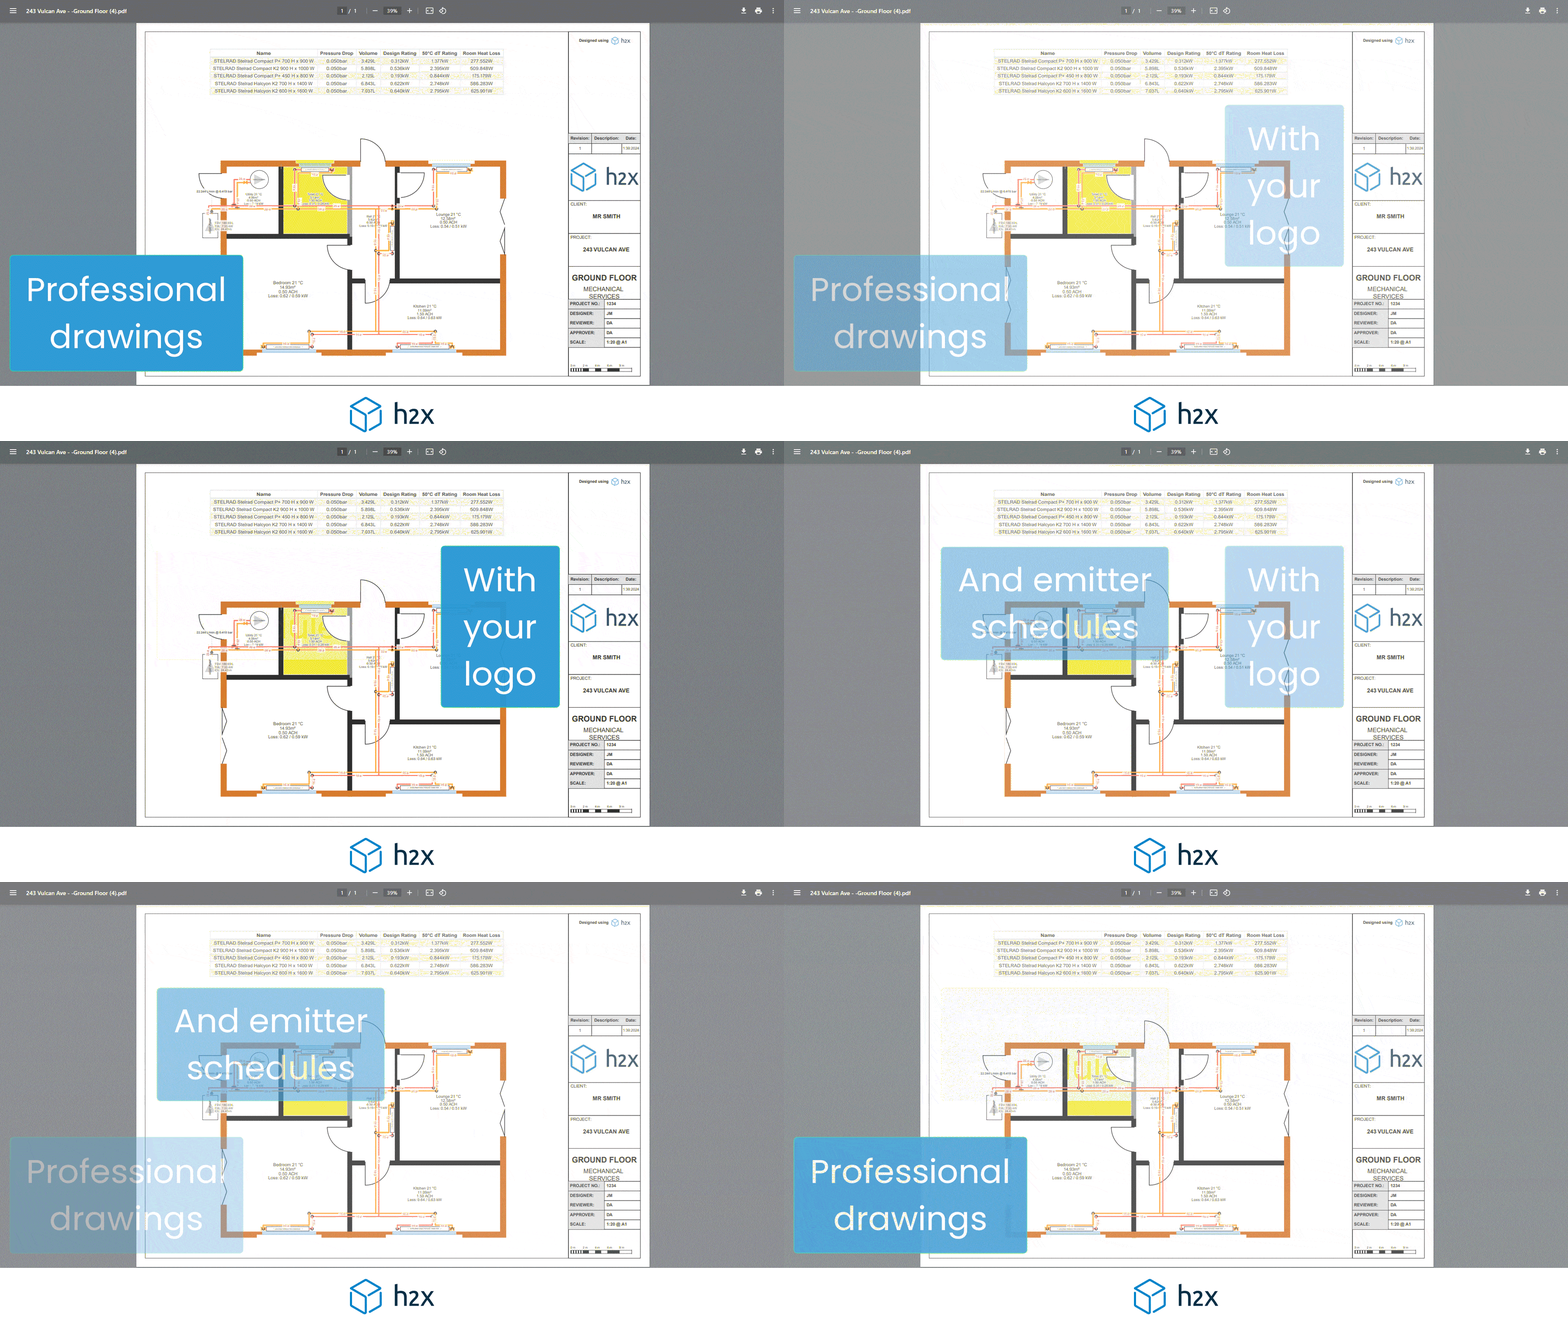
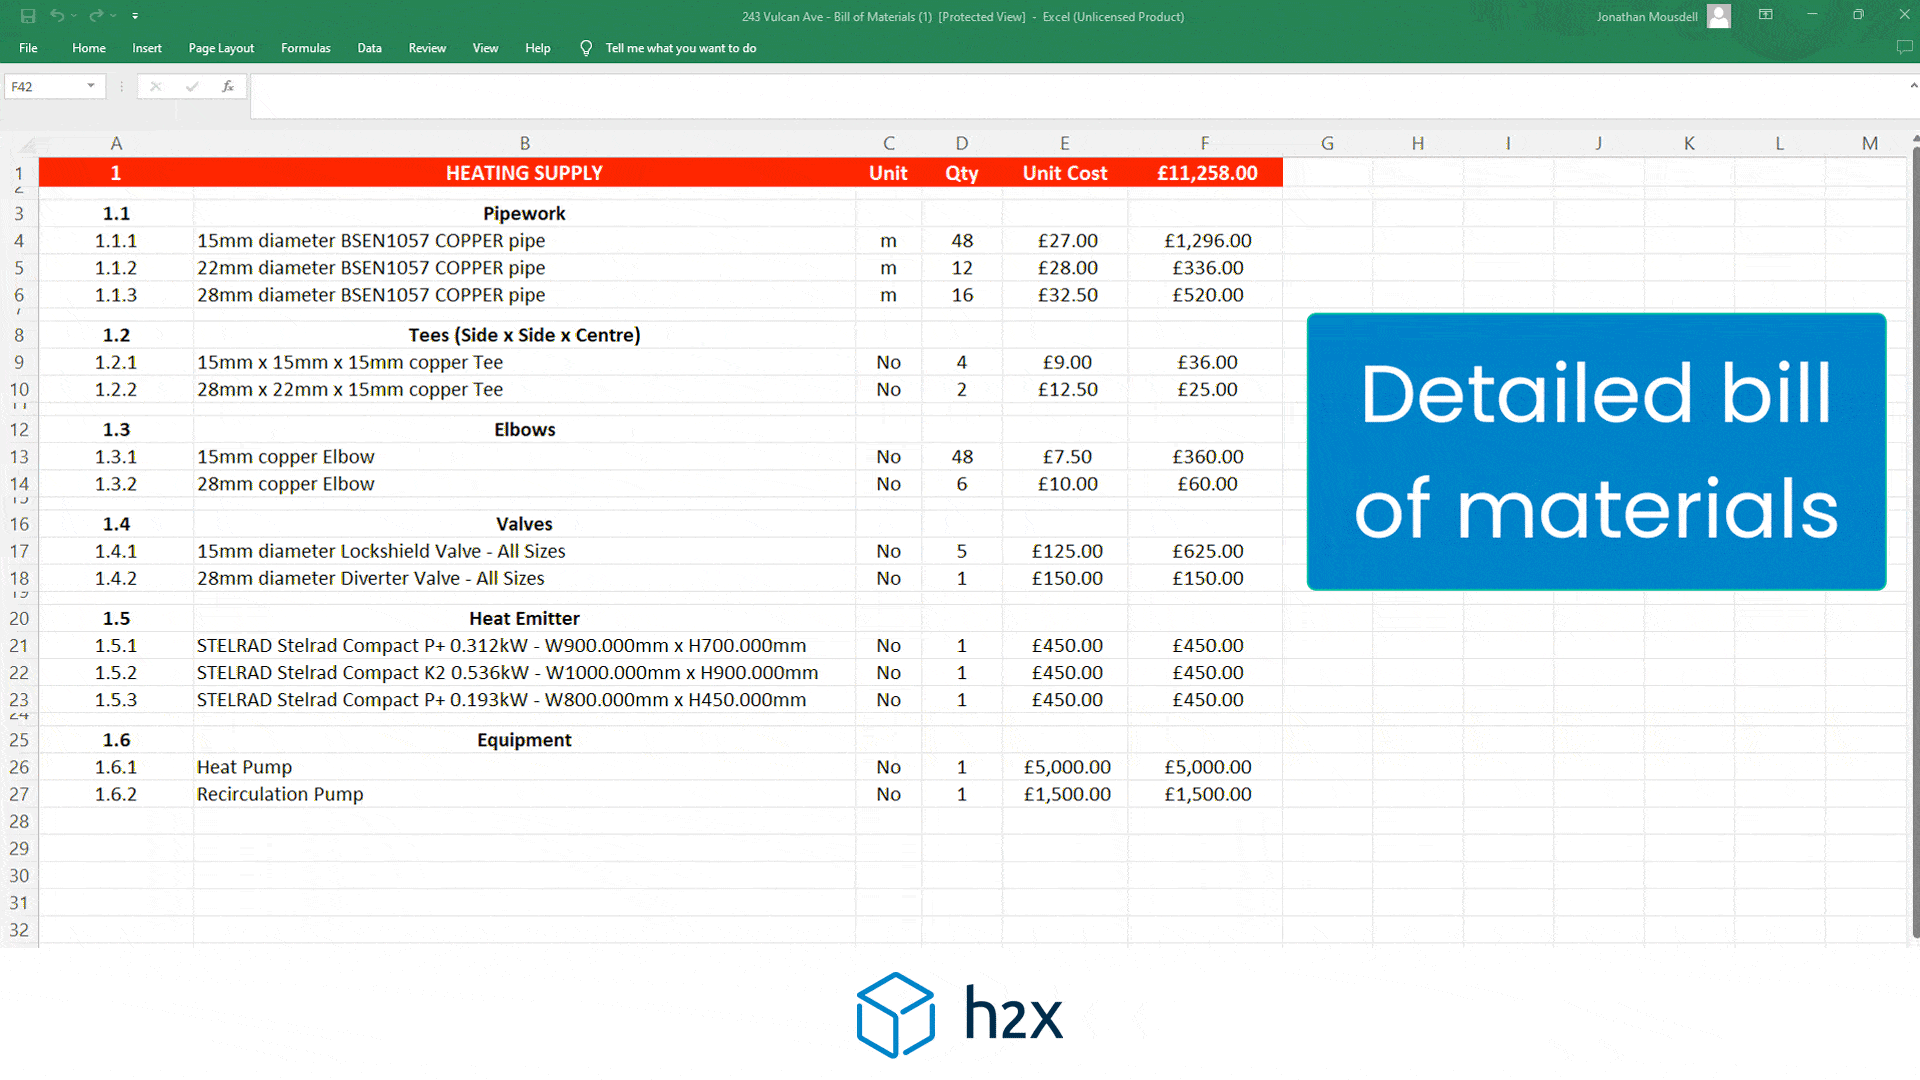
H2X automates all peak flow rate calculations based on your design layout and sizing parameters.
The video below explains the same design and calculation process using H2X:
Engineers built H2X to help engineers work faster, better and more effectively.
If you want to try H2X today, sign up for a 14-day free trial.
h2x: All-In-One Tool for Calculating, Designing, Estimating, and Paperwork

What's in the Pipeline?
Get technical resources delivered to your inbox weekly!
Testimonials
What Installers Say
What Consultants Say
A game changer for the humble plumber. Incredible.
Brad Winkel
Director at Queenstown Plumbing
Brilliant, simple and easy to use. Game changer.
James Major
Director at Hubb
Big time game changer to the industry!
Viv Jude
Director at UHC
Incredible software! Super user-friendly and allows you to save so much time.
Devni Gamage
Engineer at DMA
h2x is great software, our company use it nearly every day. It is easy to use with direct conversion from h2x to Revit.
Callum Craig
Engineer at WDE
h2x is fantastic software. It is very easy to use and the ability to output to Revit is a fantastic time saver.
Joe Kirrane
Engineer at MEP


