1.14.16 – Heatmaps
You can now visualise your pressure and velocity results using Heatmaps.
This new feature will allow our users to:
- Improve their designs by quickly identifying areas to enhance the system’s performance
- Share impressive visuals of their designs with external parties
- Teach junior engineers how systems behave and what affects the performance
Residual Pressure
Using the ‘Residual Pressure’ heatmap, you are able to visualise how the pressure changes throughout the system.
In the example above, there are notable colour differences where:
- The water travels further through the system
- The pipes change in height
Pressure Drop
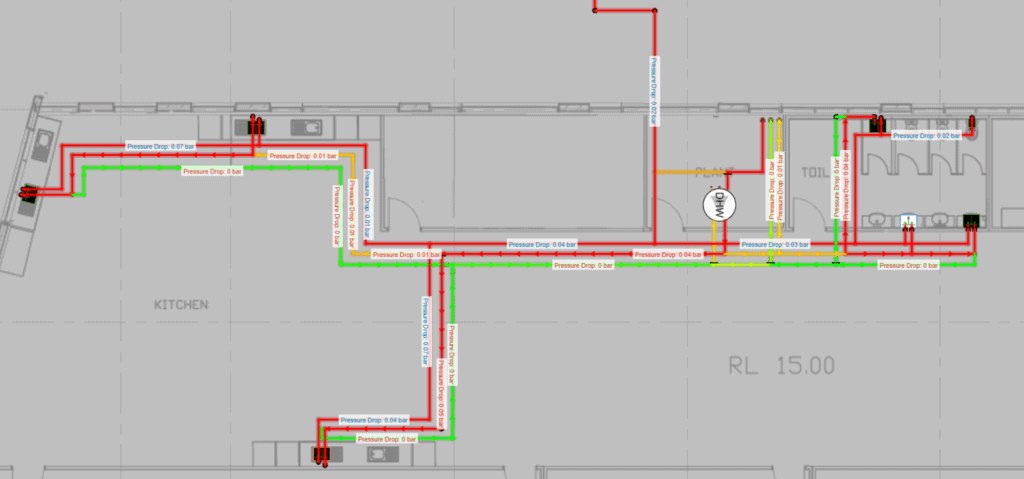
Using the ‘Pressure Drop’ heatmap, you are able to visualise the amount of pressure each pipe segment loses.
In the example above, there are notable colour differences between the flow pipes (mostly red) and the return pipes (mostly green). As the maximum velocity settings are much higher in the flow pipes, there is significantly more pressure drop per metre/foot.
Velocity
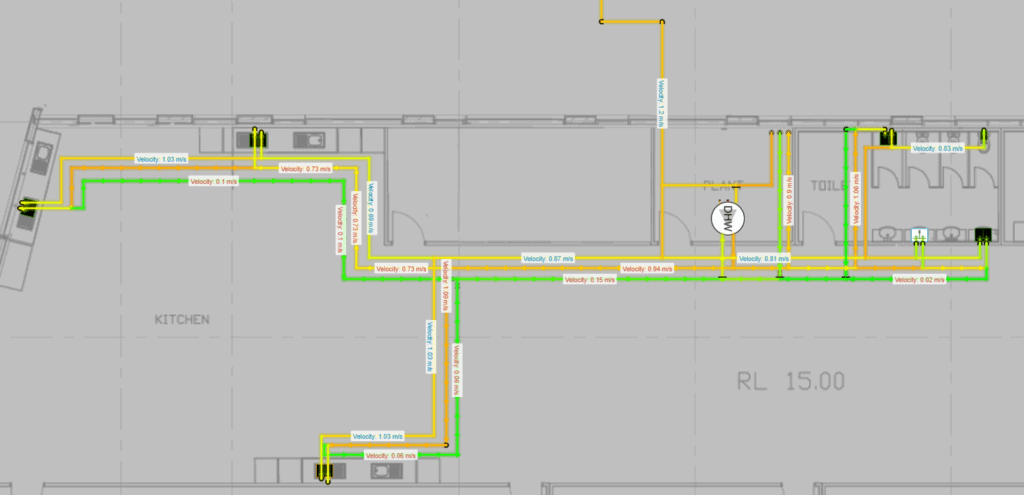
Using the ‘Velocity’ heatmap, you are able to visualise the velocity at each section of the system.
This will help you to identify areas of your system that operate below the self-cleansing velocity, or if there are sections operating at a higher velocity than you would like.

Learn more about H2X or signup for a 14-day free trial today.
h2x: All-In-One Tool for Calculating, Designing, Estimating, and Paperwork

What's in the Pipeline?
Get access to our monthly roundup of news and insights